04. Exploring Timeline Traces
Exploring Timeline Traces
Question:
Start Quiz:
Solution:
INSTRUCTOR NOTE:
To learn more about the Timeline panel in Chrome Developer Tools:
- How to Use the Timeline Tool
- Performance profiling with the Timeline
- Timeline event reference
If your Timeline tab in DevTools looks different from what is being shown in the video, note that Chrome Canary and Chrome are very dynamic platforms with new versions frequently rolling out. Try comparing what you see in Canary and Chrome, and take a look at this post in the forum as well as the Timeline links above to troubleshoot the issue.
Follow your instructors!
+Ilya Grigorik, @igrigorik
@cwpittmanCameron will be analyzing cnn.com in the answer video.
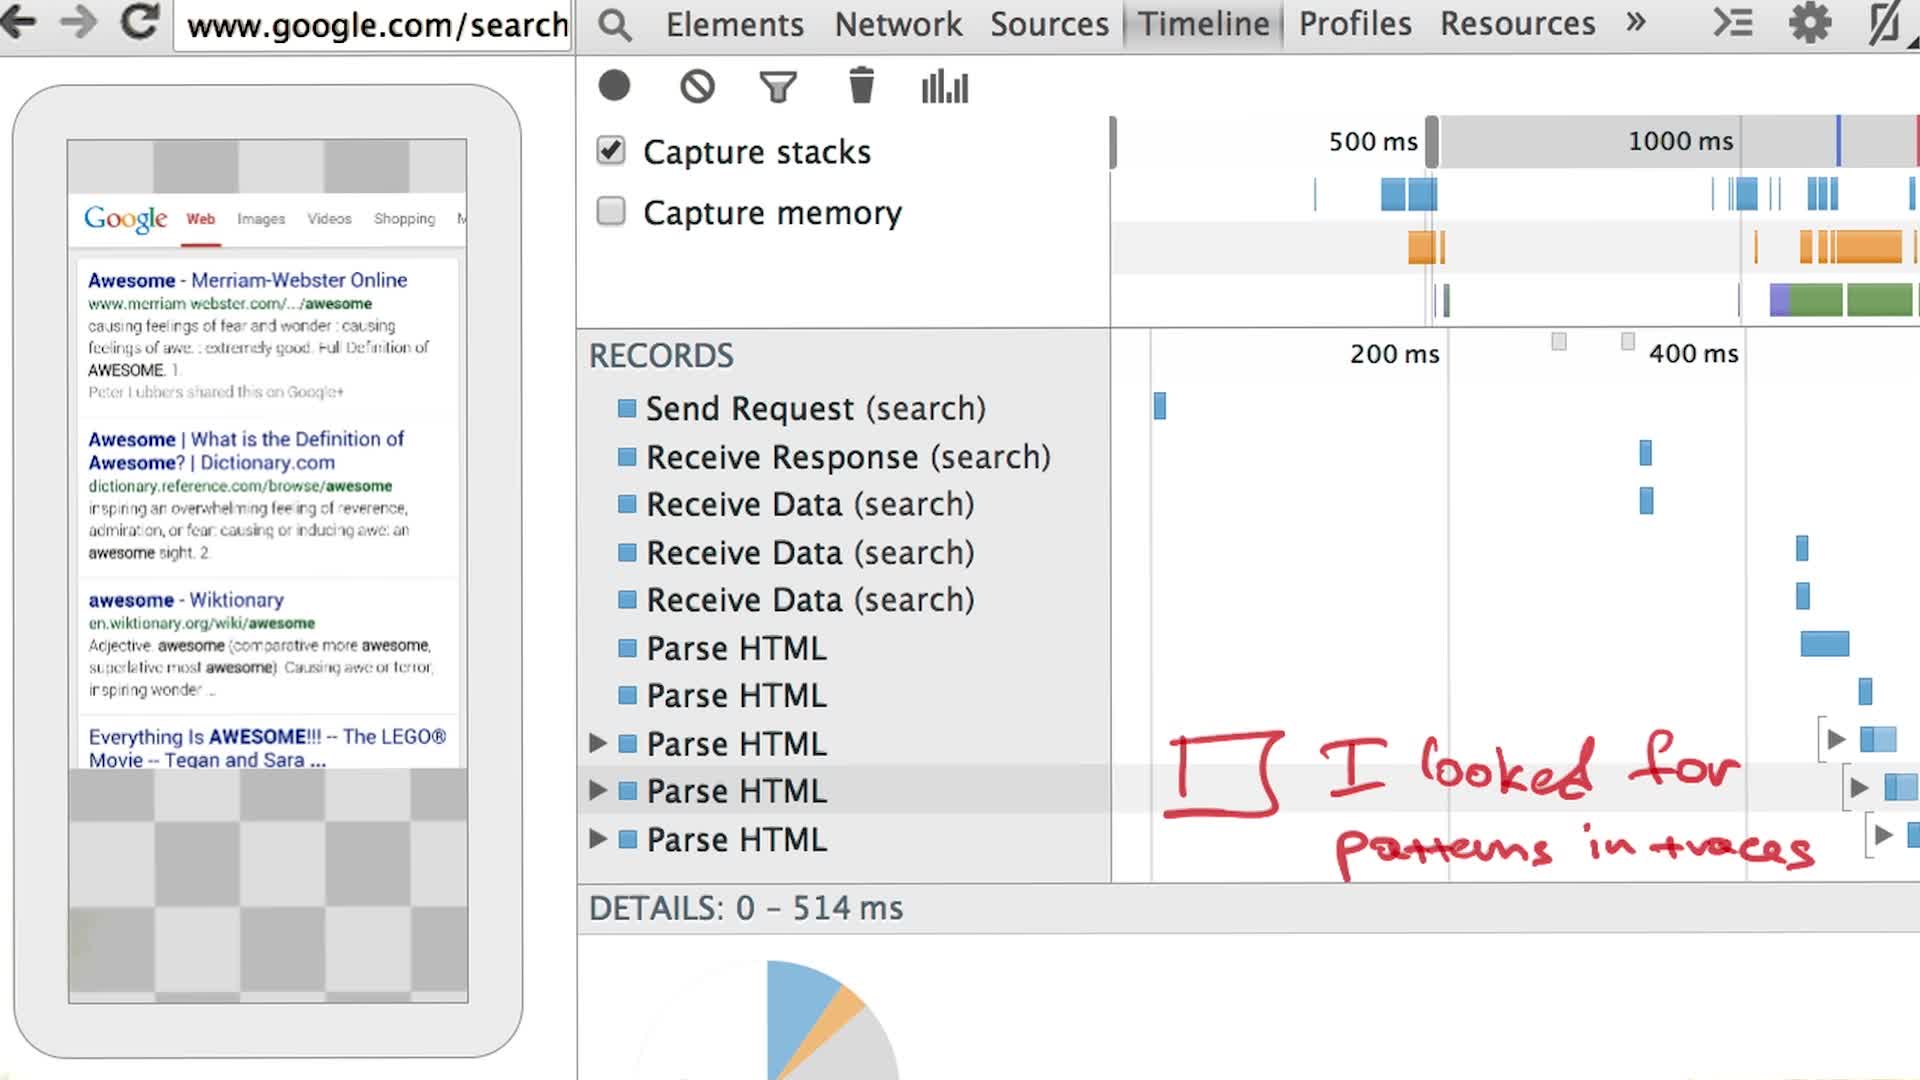
- Use Ctrl+Shift+I on Windows, or Cmd+Opt+I on Mac to open the DevTools.
- Use Ctrl+Shift+R on Windows, or Cmd+Shift+R on Mac to reload the page and capture the timeline.
PROTIP: In order to use the hard reload trick to capture the full trace, you have to load the page first, open Timeline in DevTools, start and stop recording, and then use the shortcuts described above to reload the page. Basically, open DevTools and hit the record button twice before doing a hard reload.
Check out DevTools emulation docs for a detailed walkthrough of how to emulate a mobile device.
- Use Ctrl+Shift+I on Windows, or Cmd+Opt+I on Mac to open the DevTools.